Impulse and momentum
Partner: Schyler Cordova
Date: 2/25/14
Date: 2/25/14
Purpose:
In this lab, the purpose is to investigate the relationship between impulse and momentum change.
In this lab, the purpose is to investigate the relationship between impulse and momentum change.
Theory:
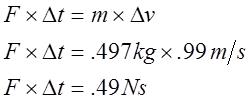
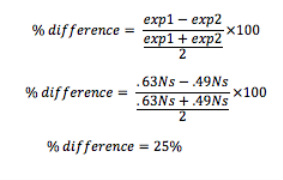
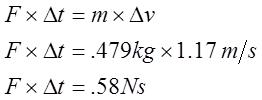
Momentum is the product of an object's mass and velocity. It is represented by the equation -P=mv and is measured in kg m/s. The equation that represents a change in momentum is ΔP = m x Δv. Impulse is a change in momentum over a specific time. Impulse equals F x Δt. Impulse is also equal to the area under the curve of a force vs. time graph. Impulse equals the change in momentum, which is represented by the equation, F x Δt = m x Δv.
Momentum is the product of an object's mass and velocity. It is represented by the equation -P=mv and is measured in kg m/s. The equation that represents a change in momentum is ΔP = m x Δv. Impulse is a change in momentum over a specific time. Impulse equals F x Δt. Impulse is also equal to the area under the curve of a force vs. time graph. Impulse equals the change in momentum, which is represented by the equation, F x Δt = m x Δv.

Experimental Technique:
1. Set up ramp, motion sensor, and force sensor (with weak spring). (See images 1 & 2)
2. Measure the mass of the cart.
3. Adjust the Hertz in Data Studio for the force sensor to 500 Hz to get a more accurate result.
4. Measure the velocity and force of the cart rolling down the incline and bouncing off the spring using the force and motion sensor in Data Studio.
5. Use the graphs of velocity and force on Data Studio to determine the impulse (area under the curve of the force graph) and the change in momentum (mass times the change in velocity).
6. Then, change the sample rate for the motion sensor in Data Studio to 100Hz, while leaving the sample rate for force at 500 Hz, for a more accurate result.
7. Next, measure the velocity and force of the cart again with the new sample rate.
8. Use the graphs of velocity and force on Data Studio to again determine the impulse and the change in momentum.
9. Finally, calculate the percent differences.
Image 1 Image 2

|

|
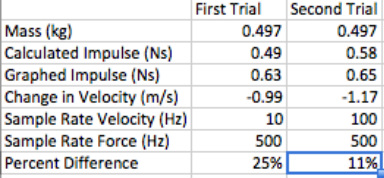
Data:


Analysis:
Trial 1 Trial 2
Trial 1 Trial 2
|
|
Conclusion:
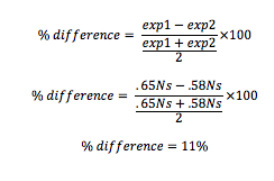
The purpose of this lab was to show that impulse equals momentum change. The impulse, as found by the area under the curve, was compared to the momentum change that was calculated by using, m x Δv. The first trial yielded a 25% difference and the second trial yielded an 11% difference. The large difference in percent differences was due to the frequency of the motion sensor. In the first trial, the motion sensor's frequency was set very low, and in the second trial, the sensor's frequency was set much higher. The percent differences could have been lower if the motion sensor's frequency could have been set higher without interference.
The purpose of this lab was to show that impulse equals momentum change. The impulse, as found by the area under the curve, was compared to the momentum change that was calculated by using, m x Δv. The first trial yielded a 25% difference and the second trial yielded an 11% difference. The large difference in percent differences was due to the frequency of the motion sensor. In the first trial, the motion sensor's frequency was set very low, and in the second trial, the sensor's frequency was set much higher. The percent differences could have been lower if the motion sensor's frequency could have been set higher without interference.
References:
Glenn Elert. (n.d.). Retrieved from http://physics.info/momentum/summary.shtml
Glenn Elert. (n.d.). Retrieved from http://physics.info/momentum/summary.shtml
